UTMARK - tidsskrift for utmarksforskning
Special issue on applied ecology
http://www.utmark.org | Number 2b 2013
Peer reviewed article.
UTMARK - tidsskrift for utmarksforskning |
|
Special issue on applied ecology |
|
http://www.utmark.org | Number 2b 2013 |
|
Peer reviewed article. |
|
Does a hunter’s Catch-per-unit-effort reflect willow ptarmigan abundance?
Abstract We surveyed 1841 Norwegian willow ptarmigan hunters to study the relationship between hunting effort and catch. We found no significant linear relationship between catch per unit effort (CPUE) and pre-estimated density of willow ptarmigan, when hunters reported on catch and effort for the whole hunting season. Following an information-theoretic approach, the most parsimonious model explaining hunting success consisted of seven factors; (1) hunting technique, (2) hunting experience, (3) number of hunting days, (4) number of days spent on planning, (5) an index of how easy it was to hunt in the terrain, (6) number of birds observed per day and (7) distance from road to the hunting terrain. We conclude that today’s use of CPUE in willow ptarmigan management is questionable, since we found no support for a linear relationship between pre-estimated willow ptarmigan density and subsequent CPUE on a local-regional scale, and that hunting success seem to depend more on the hunter’s experience, hunting effort and the number of game encounters than game density. Key words: CPUE, hunters, management, questionnaire, willow ptarmigan IntroductionCatch per unit effort (CPUE) is an often-used management measure that is supposed to reflect abundance in fish stocks (Bordalo-Machado 2006; Battaile and Quinn 2004; Harley et al. 2001) and game populations (Cattadori et al. 2003; Solberg and Saether 1999; Lancia et al. 1996; Mysterud et al. 2007). A basic assumption underlying the application of CPUE is a linear relationship between CPUE and abundance (Branch et al. 2006; Cattadori et al. 2003; Ranta et al. 2008). The model of proportionality between catch (U) as an index of abundance (N) at time (t) is: (1) Ut=qEtNt Where (q) is the catchability coefficient and (Et) is the effort at a given time. This equation can be rewritten as: (2) Ut/Et= qNt By implication, equation 2 assumes CPUE to be proportional to abundance if the effort (Et) and catchability coefficient (q) are constant over time. Managers commonly use harvest data as a proxy for population abundance (Ranta et al. 2008), implicitly assuming a linear relationship between species abundance and bag size (constant harvest rate). Since Norway started collecting national hunting statistics in 1971, between 320 000 and 750 000 ptarmigan (Lagopus spp.) have been shot annually (Statistics Norway 2007). Willow ptarmigan (Lagopus lagopus) is a monogamous, territorial, medium-sized grouse and a popular game bird (Pedersen and Karlsen 2007; Willebrand and Hornell 2001). Annually, 50 000-60 000 persons hunt willow ptarmigan (Statistics Norway 2007). Population monitoring before the hunting season in 2006, reported densities of 1-74 birds/km2 (Solvang et al. 2006). The hunting season for willow ptarmigan in Norway starts 10th September and the most intense hunting effort takes place during the first 10 days of the hunting season (Hornell-Willebrand et al. 2006; Kastdalen 1992). The juveniles begin to leave the broods in late September-early October (Smith and Willebrand 1999; Brøseth et al. 2005), coinciding with the end of the most intense period of hunting. During the transition to winter, willow ptarmigan often flock when moulting into winter plumage (white colour). Hunting is complicated by this behaviour because the birds become shy, especially in the absence of snow covered ground. This is a seasonal effect (Favaron et al. 2006) which is likely to affect hunting success. The moulting is induced by the reduction in day length (Pedersen and Karlsen 2007), and not by the amount of snow on the ground. Once the landscape becomes snow-covered the birds become less timid again and occur more frequently within the range of the hunters. In periods when the birds are spatially clustered, e.g. before brood break up, or in the moulting phase, the hunters’ search time can be reduced, and CPUE can remain stable or increase, although the population density is reduced. Asmyhr (2012) studied factors explaining CPUE among willow ptarmigan hunters in Sweden. He found that bag size was more dependent on hunting effort than willow ptarmigan density, and that bag size was at best weakly density dependent, although the hunting season in Sweden starts 17 days earlier than in Norway, and birds are expected to be easier to shoot at this time. The number of birds encountered and the gender of the hunter were the two strongest determinants of daily bag size. Hunting experience was also an important factor (Asmyhr 2012). Intuitively, it is possible to define even more factors that are likely to affect the hunter’s effectiveness. For example, shooting skills are likely to affect the hunter’s hit-rate. The physical fitness of the hunter will probably increase the ability to hunt for longer intervals, cover more ground and repeat this pattern over several days. These factors all lead to an increased search effort, and more encounters with the target species. Similar factors may also be valid in relation to the pointing dog’s performance and endurance as well, and is related to the amount of training effort invested before the hunting season. Here, we want to compare the hunting patterns of Norwegian willow ptarmigan hunters with the Swedish results provided by Asmyhr (2012) by addressing the following questions:
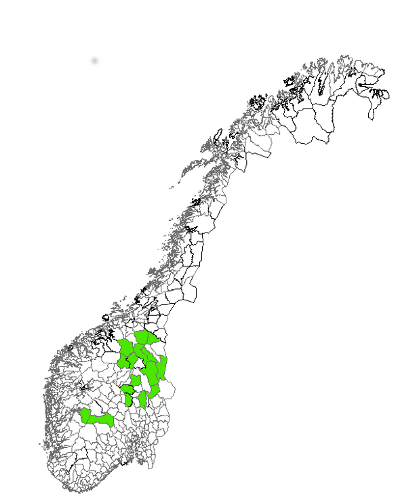
Materiale and methodsDensity estimatesWillow ptarmigan density (expressed as birds per km2) in 18 hunting areas (see Figure 1; hereafter called the study area) was estimated by using line transect counts with pointing dogs and the program Distance sampling (Buckland 2004; Buckland and Anderson 2001) in mid to late August prior to the hunting season, 2006. The 18 hunting areas were in the population monitoring program administrated by Hedmark University College (Solvang et al. 2006) and chosen to cover a wide range of ptarmigan densities (Figure 1). Data collectionWe used a postal questionnaire to hunters who had hunted within the study area. Data collection procedures followed the tailored design method (Dillman 2006). In total, 2855 questionnaires were sent to hunters shortly after closure of the hunting season in February 2007. After one reminder, the study closed in May 2007. We obtained 1841 answers, a response rate of 67.8%. The sample covered 3.4 % of all ptarmigan hunters in Norway during 2006 (SSB 2007). The hunting terrains within the study area covered a variety of landscape gradients from the mountain ranges in central parts of Norway and can be considered representative of willow ptarmigan hunting areas in Norway (Figure 1). Daily bag limits were not commonly used as a harvest regulation tool in the study area when data were collected. However, in those areas where the harvest was regulated, the daily bag limits were too high to significantly reduce the individual hunter’s daily bag size (e.g. <6 birds per day).
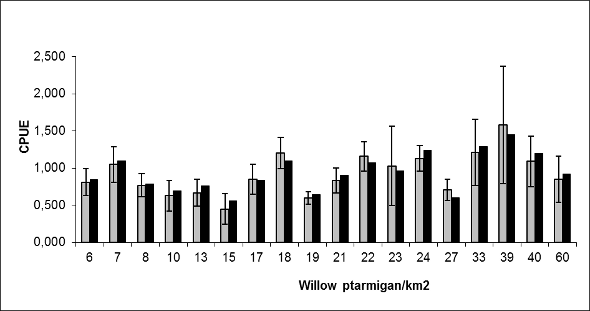
Statistical analysesData were analysed with the program SAS ver. 9.1. The response variable was CPUE, calculated using the self-reported number of willow ptarmigan shot during the hunting season, divided by the self-reported number of hunting days. We calculated it in two different ways: CPUE1 (individual hunting success) was the mean CPUE (± 2 S.E.) across all the hunters in a given area during the season; CPUE2 was the total number of willow ptarmigan shot in each hunting area divided by the total number of hunting days in each area (a value without any variation). The relationship between CPUE1 or CPUE2 and density was analysed by applying linear regression, based on the assumption of a linear relationship (Figure 2). To determine how individual hunting success (CPUE1) was affected by factors related to the hunter and the hunting terrain, a general linear model (GLM) was performed. We used the PROC REG procedure with the identity link function, and Bayesian information criterion (BIC) as our selection criterion. This is because BIC adjusts for sample size differently and penalizes models with a greater number of predictors more harshly than Akaike’s information criterion (AIC) (Quinn and Keough 2003). The model with the lowest BIC value was considered the best compromise between explaining much of the variation with as few parameters as possible. Predictor variables in the GLM models were: (1) estimated ptarmigan density (km2), (2) hunter’s age, (3) hunting experience (number of year as a hunter), (4) hunting method (with pointing dog, mixed or without pointing dog), (5) local or non-local hunter, (6) number of years hunting in the same area, (7) a subjective index of how easy it was to hunt in the hunting terrain, on a 5-point scale from very difficult to very easy, (8) average number of willow ptarmigan encountered per day, (9) number of shots fired on clay pigeon shooting ranges before the hunting season, (10) number of days the hunter exercised before the hunting season, (11) number of days spent training the gun dog before the hunting season, (12) number of days spent on planning the hunting trips, choice of area etc., (13) distance between roadways and hunting areas, and finally (14) number of days spent hunting during 2006. The last variable (14) was also used as the effort component of the response variable, but we also included it as an explanatory variable as it was not significantly correlated with CPUE1. We had no information about hunting pressure per km<sup>2</sup> exerted by other hunters from the 18 hunting areas in this study. ResultsDescriptivesThe sample consisted of 93.2% (n=1503) males and 6.8% (n=110) females, while 228 respondents did not report gender. Mean age was 49.5 years (± S.E. 0.36), and hunters had on average 21.9 years (± S.E. 0.38) of hunting experience. During the season, they hunted on average 7.1 days (± S.E. 0.17). CPUE varied from 0 (n=288; 20.6%) to 10.3 willow ptarmigan shot/day, with an average of 0.85 willow ptarmigan shot per hunting day. Fifty per cent of the hunters reported a CPUE of less than 0.6 willow ptarmigan per hunting day. Approximately one half (53.4%, n=849) of respondents hunted only with bird dogs and 32.2% did not use dogs (n=512), while 14.3% (n=228) engaged in both forms of hunting. Almost everyone (96.5%, n=1529) reported that the hunting terrain was easy or very easy to hunt. The respondents reported on average 2 days (± S.E. 0.10) spent on planning, and 175 training shots (± S.E. 10.73) at clay target shooting ranges before the hunting season. As a part of hunting preparations, they reported an average of 17.6 days (± S.E. 0.56) spent on preparing/training themselves and hunters with dogs reported an average of 15 days (± S.E. 0.62) spent on dog training. Finally, the reported mean distance from a roadway to the hunting terrain was 3.7 km (± S.E. 0.20). CPUE and abundanceThe average CPUE1 for the 18 areas in this study was 0.91 ptarmigan/day (± S.E. 0.07), but ranged from 0.4 – 1.58 willow ptarmigan/day (Figure 2). Pre-estimated density ranged from 6 – 60 willow ptarmigan/km2 (Figure 2), with an average of 22.6 willow ptarmigan/km2 (± S.E. 3.42). Linear regression showed that CPUE1 was not significantly related to pre-estimated ptarmigan density among these areas (F1, 16= 2.96, p=0.105) and explained 15.3% of the variance. CPUE2 improved the relationship slightly (explained 17.5 % of the variance), but was still not significantly related to pre-estimated ptarmigan density among these areas (F1, 16= 3.38, p=0.085).
Hunting successThe most parsimonious model of individual hunting success (BIC: -280.284, F7,559=16.7, p=0.001) included parameters as shown in Table 1. Hunting experience was the least significant variable among those included in the final model, showing a weak, positive slope. Number of willow ptarmigan observed per day and distance from roadway to the hunting terrain showed stronger positive slopes. The negative estimate for the ease of hunting index indicated that CPUE decreased with increasing difficulty to hunt in the terrain. Hunting technique indicated that hunters without a pointing dog were more successful than hunters with a pointing dog, throughout the season. Number of days spent on planning, and number of days hunting also showed weak, negative slopes (Table 1). Table 1. Variables in the most parsimonious model explaining hunters CPUE. N= number of responses, Mean= average value, S.E.= standard error, β =Unstandardized regression weights and p-values. Score values from categorical variables not shown, but described in text.
DiscussionThe male-biased gender distribution among the studied hunters (93.2% males and 6.8% females) was in accordance with the national hunting statistics reported by Statistics Norway (2007). The average total effort per hunter constituted approximately a week of hunting, and bag data showed 0.85 bagged willow ptarmigan per hunting day. However, the relatively high proportion of hunters with an average bag of less than 0.6 willow ptarmigan/day indicated a skewed (Poisson) distribution of bag size. CPUE and abundanceWe found no support for the assumption that CPUE was linearly proportional to the estimated density, which is assumed to reflect abundance of willow ptarmigan prior to the hunting season in the way data were collected here. This was consistent with the findings of Asmyhr (2012). However, Cattadori et al. (2003) found such a relationship for red grouse when data were log-transformed, but no such relationship before data were log-transformed. Reasons why CPUE might not be proportional to abundance have been investigated, especially in fish stocks (Harley et al. 2001; Maunder et al. 2006). The most common form of non-proportionality involves CPUE remaining high while abundance declines due to increasing effort, or if hunters are still efficient at low population densities. This is known as hyperstability and can lead to over-estimation of population size and over-expolitation (Harley et al. 2001). The catchability coefficient can be influenced by several factors; firstly, game abundance which is assumed to be associated with the number of bird encounters, but as birds can be clustered a high CPUE may occur despite low densities (hyperstability); secondly, the hunter’s harvest rate (their hit rate and the fact that only two shots can be fired at the same time from a shotgun, independently of whether one or 10 birds are flushed), and thirdly the bird’s behaviour and weather conditions (shyness). Effort can also vary a lot between hunters and areas. In addition, it is likely that in areas with high hunting pressure, the CPUE per hunter will be affected, as the number of hunting days per km2 increases and the number of birds remaining decreases. Our study dealt with low densities (range 6-60 birds/km2) compared with those ranging from 150 to 700 birds/km2 reported by Cattadori et al. (2003). Ranta et al. (2008) found a linear relationship between CPUE and density for three grouse species; capercaillie (Tetrao urogallus), black grouse (Tetrao tetrix) and hazel grouse (Bonasa bonasia) in Finland, when analysing data in the same way as Cattadori et al. (2003). Ranta and colleagues (2008) also reported that the pattern of population dynamics derived from bag data was different from that shown by census data. Asmyhr (2012) and Willebrand et al. (2011) urged caution in relying on bag size as an index of willow ptarmigan abundance because harvest rates were primarily determined by hunter effort and game encounters, and to a far lesser extent by bird density. This argument illustrates the need for caution in interpreting wildlife bag data as reliable parameters in population dynamics (Ranta et al. 2008; Asmyhr 2012; Willebrand et al. 2011). For ptarmigan, it is likely that a shorter data collection period, e.g. the first two weeks of the hunting season, may provide more reliable data because the major share of the hunting effort occurs within the 10-15 days at the start of the season. At this time the broods have not split-up or been substantially reduced by hunters. Hunting successRimpi (2005) reported a positive effect of experience on hunting success in Sweden (Rimpi 2005). Experienced hunters can be more efficient in terms of not wasting time hunting in less attractive areas. In our study, the number of willow ptarmigan observed per day seems to be a better index of CPUE than density prior to the hunting season, since bird density was not included in the best model. These findings are partly supported by Asmyhr (2012), who reported that daily bag size was at best weakly density dependent. We found a positive relationship between distances from roadways to the hunting terrain and CPUE, which is in accordance with the research literature. Brøseth and Pedersen (2000) fitted GPS transmitters to hunters, and found that willow ptarmigan hunters walked on average 16.2 km daily at a speed of 2.8 km/h, and they hunted for 9 hours each day, of which almost 6 hours was active hunting time. Hunting pressure was strongly dependent on the starting point, and areas closer than 2.5 km to the base cabin were subject to 82% of the hunting activity. Areas furthest away, were subject to lower hunting activity, and thereby support our positive correlation between CPUE and distance from the nearest roadway. Rugged terrain can explain the negative relationship between how easily-hunted the terrain was, and hunting success, because this type of terrain offers more hiding places for birds. It is also likely that some hunters avoid hunting in rugged terrain within their overall hunting areas. Hunting success also varied with hunting technique such that hunters without a pointing dog were more successful than hunters with a pointing dog, throughout the season. This may be because of seasonal effects such as bird behaviour and clustering, which in turn can affect harvest rates. The effect of preparation, such as choosing hunting destinations, are more difficult to explain, because most of the hunting licences for the first weeks of the season are acquired by the non-local hunters during summer, before willow ptarmigan abundance is monitored. The number of days spent hunting also showed a weak, negative relationship indicating a lower CPUE or catchability, throughout the season for experienced hunters. Lindberget (2009) reported that the willow ptarmigan harvest during the first four days or accumulated over the first eight days of the hunting season not did affect CPUE in the following four day period in Sweden (Lindberget 2009). Bunnefeld et al. (2008) analyzed harvest data from 43 drives on 8 moors in North-England. No effect of the number of grouse counted per square kilometer in July was found on subsequent harvest rate at the first shooting event, but they reported significant differences in intercept (lower for the second shooting event, compared to the first, and the third/fourth shooting event compared to the second), and the same slope in models of grouse shot per km2 in relation to population density in July. These results indicate that effort strongly affects CPUE (Bunnefeld et al. 2008) at high densities. By contrast, no such effect was found among willow ptarmigan hunters hunting on state land in Sweden, where ptarmigan density rarely exceeds 40-50 birds/km2 (Lindberget 2009). These findings raise the question of whether the relationship between CPUE and abundance becomes density dependent at some threshold, since willow ptarmigan densities in Scandinavia are in general considerably lower than in Britain (Hudson 1992). Management implicationsOur findings suggest that today’s use of CPUE is not a reliable measure of game abundance for willow ptarmigan management in Norway, especially at a local-regional scale. CPUE should be regarded as a measure of the individual hunter’s effectiveness, rather than a reliable reflector of the actual population density. Further, we have shown that there are several intrinsic (i.e. individual skills) and extrinsic factors (i.e. terrain features) that affect CPUE. Our results also underline the need for standardized monitoring systems to interpret and evaluate important hunting management parameters such as CPUE in small game management across different management units. ReferencesBuckland ST (2004) Advanced distance sampling. Oxford University Press, Oxford Dillman DA (2006) Mail and internet surveys : The tailored design method. 2nd edn. Wiley, New York Kastdalen L (1992) Skogshøns og jakt (in norwegian). Norges bondelag, Oslo Lindberget M (2009) Användande av avskjutningsstatsitik i förvaltning. Påverkar tidigare jakt cpue? Master thesis, Sveriges lantbruksuniversitet, Pedersen HC, Karlsen DH (2007) Alt om rypa (in norwegian). Tun forlag, Oslo |
||||||||||||||||||||||||||||||||||||||||||||||||||||||||||||||||||||||||||||