UTMARK - tidsskrift for utmarksforskning
Special issue on applied ecology
http://www.utmark.org | Number 2b 2013
Peer reviewed article.
UTMARK - tidsskrift for utmarksforskning |
|
Special issue on applied ecology |
|
http://www.utmark.org | Number 2b 2013 |
|
Peer reviewed article. |
|
Natural ptarmigan refuges; do they exist and do they result in higher ptarmigan densities?
AbstractIn hunted bird populations human activities represent both a potential direct effect through mortality (hunting) and an indirect effect linked to disturbance. Following the decline in the Norwegian willow ptarmigan population, increased attention has been paid on hunting as an important mortality factor in these populations. More developed road network and increased number of buildings in remote areas have given greater accessibility to ptarmigan hunting areas in Norway. Against this background, we here investigated to which extent so-called “natural refuges” still exist in Norway, and present results from a GIS-based survey. In particular, the purpose of the present study was to; 1) examine to what extent there still exist natural refuges for willow ptarmigan in central Norway, and 2) examine whether there was a positive correlation between the proportion of natural refuges and willow ptarmigan density in the respective management units. The study is based on data from 16 different management areas in two counties in central Norway. The results showed that such natural refuges were present to a limited degree, with some exceptions. There was a tendency for the proportion of suitable willow ptarmigan habitat to be higher inside the refuges compared to outside of the refuges, but the difference was not significant. There was a significant positive correlation between the proportion of natural refuges inside the management units and willow ptarmigan density inside the management units. In the discussion we shed light on both ecological and methodological issues that might explain our findings. Finally we point out some management implications concerning our findings. Key words: Norsk sammendrag:Hos jaktbare fuglearter vil menneskelig kontakt både representere en potensiell direkte effekt knyttet til mortalitet (jakt) og en indirekte effekt knyttet til forstyrrelse. I de senere år har det med bakgrunn i en nedadgående populasjonsutvikling hos lirype nasjonalt, vært økt fokus på jaktas betydning som mortalitetsfaktor. En økende tilgjengelighet til rypeterreng i Norge, gjennom et mer utbygd veinett og et økende antall bygninger i utmark, har aktualisert problemstillingen om hvorvidt det fortsatt eksisterer terreng som i liten grad kan nås av rypejegere. Disse terrengene kan vi kalle naturlige refugier. Her presenterer vi resultatene fra en GIS-basert undersøkelse, som hadde som målsetning å 1) undersøke i hvilken grad det fremdeles finnes naturlige liryperefugier i Trøndelag, samt 2) å undersøke hvorvidt det var en positiv sammenheng mellom andelen naturlige refugier i et forvaltningsområde og tettheten av lirype. I artikkelen benyttes data fra 16 ulike forvaltningsområder i Nord- og Sør-Trøndelag. Resultatene viste at slike naturlige refugier fantes i begrenset grad, med noen unntak. I seks av sju undersøkte forvaltningsområder, var det en høyere andel egnet lirypehabitat innenfor disse refugiene enn utenfor, men denne forskjellen var ikke signifikant forskjellig. Det var en signifikant positiv korrelasjon mellom arealandel naturlige refugier innenfor forvaltningsområdene og lirypetettheten i de samme områdene. I diskusjonskapitlet belyser vi både økologiske og metodiske forhold som kan forklare våre funn, samt foretar noen forvaltningsmessige vurderinger i forhold til funnene. IntroductionThe potential for negative impacts of human activity on wildlife populations has received increasing attention in wildlife management the last decades (Gill et al. 1996, Finney et al. 2005, Kerbiriou et al. 2009). For hunted species, human activity can affect the populations either directly through hunting, or more indirectly through a wide range of disturbance effects (Brøseth & Pedersen 2010). Previous studies have shown that such indirect effects can affect the physiology (Weimerskirch et al. 2002), behaviour (Andersen et al. 1996) and patterns of space use (Gill et al. 1996) of the focal species. Such changes might in turn affect the risk of predation (Anderson 1988) and thus potentially increase the effect of the already existing harvest mortality. In a survey among 53 landowners that provided ptarmigan (Lagopus spp) hunting opportunities in Norway, ptarmigan was reported to be the most important small game species both in terms of distribution and economic significance for the landowners (Andersen et al. 2010). Indeed, among small game species in Norway, Willow ptarmigan (Lagopus lagopus) is subject to the highest hunting effort and hunting bag (SSB1). During the last decades, the effect of hunting mortality on willow ptarmigan populations has received increasing attention (Storch 2007, Pedersen et al. 1999, Smith & Willebrand 1999, Pedersen et al. 2004, Sandercock et al. 2011). While the formerly held position was that only about 10% of the willow ptarmigan populations were harvested annually, more recent surveys have indicated that hunting might kill more than 50% of the population under certain conditions (Pedersen et al. 1999), and that the hunting mortality is largely additive to natural death when above a certain level (Sandercock et al. 2011). In general, economic growth in Norway, more vacation and an increased mobility among the general public are presumed to be the main factors explaining the increased number of ptarmigan hunters in Norway during the recent decades (Pedersen & Storaas 2013). Further, access to most hunting grounds have become improved (SLF & DN 2010) due to more forest roads and a higher number of cabins in many regions (SSB2). It might thus be speculated that large areas formerly being quite inaccessible for ptarmigan hunters in Norway are now much more accessible than they were just a few decades ago (Pedersen & Karlsen 2007). This is one of the hypotheses that have been put forward to explain the negative population trend in Norwegian ptarmigan populations (Pedersen & Storaas 2013). In general, the hunting intensity will often be spatially heterogeneous within hunting management units (McCullough 1996, FitzGibbon 1998), and are generally higher closer to the access point for the hunters – often a road or a cabin (Andersen et al. 2008, Brøseth & Pedersen 2000). To compensate for the assumed lack of such “natural refuges” for willow ptarmigan, it has been suggested to re-establish non-hunted areas that can act as refuges (Willebrand & Hörnell 2001, Pedersen & Karlsen 2007). The main idea is to re-establish a source-sink dynamic (Pulliam 1988), where non-hunting refuges will serve as source areas that produce a surplus of birds that will disperse to the hunted areas, and thus reinforce the local populations (see e.g. Novaro et al. 2005). In the last 10 years, a few experiments have been carried out in Norway trying to create such managed refuges were hunting have been prohibited. So far, the effect of such refuges on ptarmigan population dynamics is not clear, mainly because of problems with the size and locations of the refuges, overall low ptarmigan density in the study period, and difficulties with the data sampling (see Pedersen & Storaas 2013). In this study, we mapped the existence and extent of natural refuges for willow ptarmigan in central Norway. Given that such areas exist and that the hunting pressure is reduced within these refuges, a negative effect of hunting mortality on willow ptarmigan populations would suggest a higher ptarmigan density in these areas. On this basis this article aims to:
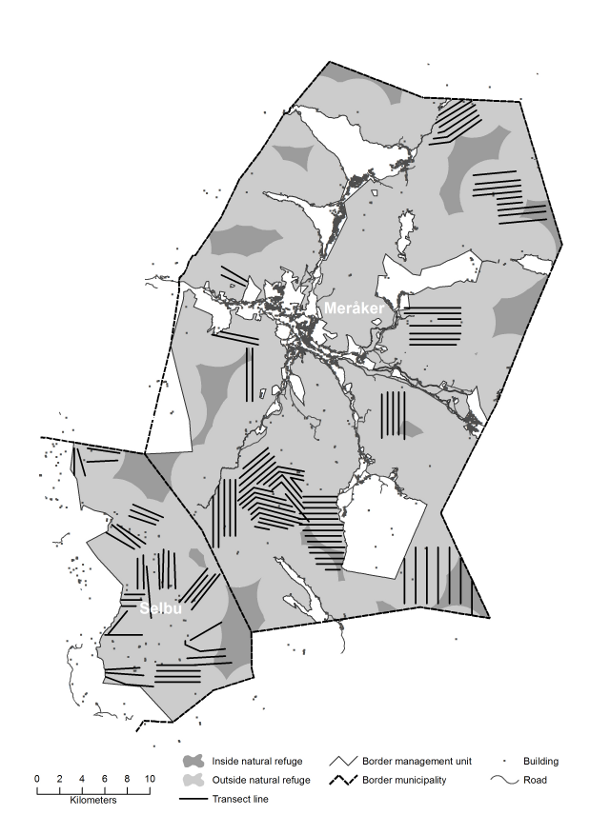
Materials and methodsIn this study, we used data from five hunting seasons (2008/2009 – 2012/2013) in 13 management areas on state ground and 3 private areas, distributed across 14 municipalities in the counties South-Trøndelag and North-Trøndelag (table 1). The size of the management areas varied between 39 and 1430 km2 (table 1). In seven of the management areas, the willow ptarmigan density was estimated by annual surveys in the autumn, based on line transect distance sampling methods (Buckland et al. 2005), whereas the population density was estimated in at least 3 of the five years in the remaining areas. The number of transect lines in each area varied between 6 and 78, and the total length of the transect lines for each area varied between 28 and 305km (table 1). Ptarmigan hunting took place in all areas in the study period 2008-2013. Table 1:
The two counties are among the most important counties for ptarmigan hunting in Norway. During the last years, these two counties have had the highest proportion of hunters among the public (SSB3), and North-Trøndelag had the highest hunting bag of willow ptarmigan during the years 2009/2010 through 2011/2012 (SSB1). The presence and location of roads through the management areas were extracted from the geodatabase VBASE (The Norwegian Mapping Authority; NMA), whereas the location of buildings, including cabins, were extracted from N50 maps covering Norway (NMA). We uploaded the map data in a GIS (ArcGIS 10.0), and buffered the roads and buildings inside or adjacent to the management areas with 3km buffers. The size of the buffers was chosen because this is assumed to represent the distance travelled by an average ptarmigan hunter on an average hunting day (Brøseth & Pedersen 2000). Then, the size of the management units not covered by the buffers, were calculated and assumed to represent natural refuges. First, we calculated the total area size of the natural refuges. Then for the management units who had refuges that cover > 10% of the total area, we excluded habitats assumed to be not suitable for willow ptarmigan. We used SatVeg (Erikstad et al. 2009) as a basis for this analysis, and used the habitat suitability model presented in Pedersen et al. (2005) as a basis to assess habitat suitability for willow ptarmigan. Thus, 13 of total 25 different habitat classes were considered suitable (see Pedersen et al. 2005).
The proportion of suitable willow ptarmigan habitat inside the natural refuge was then compared with the proportion of suitable habitat outside the refuge, using a Mann Whitney-U test. The relationship between the proportions of refuge in the different management areas was related to the mean estimated ptarmigan density, by using a Spearman rank correlation test. ResultsIn three of the total 16 management units, no areas were located > 3km from roads or buildings (table 2), in other words, they had no refuges as defined in this study. In the remaining 13 units, the proportion of the areas located > 3km from roads or buildings varied between 0.6% and 40.6%, and the largest natural refuge covered an area of 544.4km2 (table 2). Table 2:
When focusing only on the management areas where the refuges covered >10% of the total area and excluding non-suitable ptarmigan habitat, the refuges covered between 7.8% and 31.8% of the respective management units. The largest natural refuge in terms of suitable willow ptarmigan habitat covered an area of 434.4km2 (table 2). Six of the seven examined management units, had a higher proportion of suitable willow ptarmigan habitat inside the refuges than outside (table 3), but there was no statistical difference in the proportion suitable habitat inside or outside the refuges (Mann Whitney-U test: n1 = 7, n2 = 7, p > 0.05). Table 3:
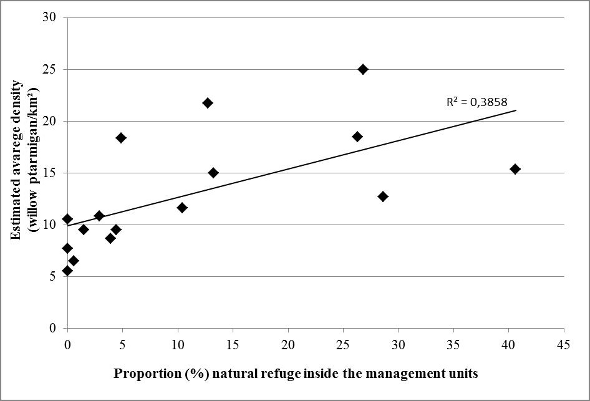
The mean estimated density of willow ptarmigan varied between 5.5-25.0 ptarmigans/km2 through the study period in the different management units. There was a positive correlation between the mean density in the management units, and the proportion of the units that were classified as refuges (rho = 0.62, n = 16, p = 0.01, Spearman rank correlation; figure 2). Our low sample size did not allow us to test for any non-linarites in the relationship. Further, there was significantly higher mean densities in areas with >10% natural refuges compared to those that had < 10% (all units; 1 = 7, n2 = 9, p < 0.001; only units with > 0% refuges: n1 = 7, n2 = 6, p = 0,001, Mann Whitney-U test).
DiscussionOur results showed that there were little “natural refuges” in our study area that could not be reached by hunters within a day from roads or buildings. In management units with such refuges, they covered on average 14% of the total management area. When unsuitable willow ptarmigan habitats were omitted, these refuges were further reduced by on average 5%. In six of the seven managed units that were analysed for willow ptarmigan habitat suitability, there was a larger proportion suitable habitat within than outside the natural refuges. This latter finding might increase the value of these more remote areas, in terms of their potential to act as sources in a source-sink dynamic. Our results confirm the hypothesis that large areas being unreachable for willow ptarmigan hunters or at least receiving reduced hunting effort, no longer is common in our study area. However, we caution against generalizing these results across all regions of Norway. We therefore recommend similar studies to be carried out in other parts of Scandinavia, to investigate to which extent our findings confirm to the general pattern. Further, we have not conducted analysis to eventually uncover if some of the buildings or roads in this study have been closed for the hunters. Our approach has been that all roads and buildings have been potentially accessible for hunters. If many of the cabins are not used by ptarmigan hunters during the fall hunting, then the extent of natural refuges might be somewhat higher than indicated by using the definition of a natural refuge that we used in the current study. Likewise, if some areas are visited by a substantial number of ptarmigan hunters using mountain tents for lodging, then the hunting pressure might be similar also in the areas far from roads and cabins. However, we are not aware of any data that could be used to test the latter, so this remains speculations. In a survey among approximately 3000 willow ptarmigan hunters in Norway, the majority of the willow ptarmigan hunters (86%) reported that they used some kind of cabin during their ptarmigan hunt (Andersen et al. 2008). Ptarmigan managers in the study by Andersen et al. (2010) further agreed that cabins were important to exploit the economic potential for small game hunting on their land, although they did not quantify exactly the cabin usage in their management areas during the hunting season. However, over 50% of these managers reported that they had on average 15 cabins per management units for this purpose. Despite the fact that a small proportion of terrains characterised as refuges according to the definition we applied, there was a significant positive correlation between the proportion of refuges and average ptarmigan density inside the management units. Based on the initial theory, this could be expected given that hunting and/or human disturbances negatively affect willow ptarmigan density and production. However, other studies have shown that predation, particularly on nests, from medium-sized mammals and corvids can be higher near cabins than further away (Støen et al. 2010, Røhnebæk 2004, Pedersen et al. 2006). Also given higher densities of power lines and/or different types of fences near roads/buildings, one should expect higher willow ptarmigan mortality rates caused by collisions (see Bevanger 1998), leading to even further negative impact on the ptarmigan populations. The correlation analyse used here do not reveal the cause- and effect underlying our results, so quantification of the strength of different local mortality factors are required to understand the causality. Our approach may have a weakness as the transect lines used to estimate population densities often start in connection with roads. Since the transect lines in the respective management units reach a few kilometres from the starting point, they mainly give a density estimate for the most accessible part of the management area. The density of willow ptarmigan in more remote areas, with a higher proportion of suitable ptarmigan habitats and a lesser density of transect lines, could therefore potentially be higher than the estimated average for the whole management unit. To complement this study we thus suggest that future studies should investigate the relationship between ptarmigan density and distance from roads and buildings on a smaller scale. Willow ptarmigan chicks disperse in varying degree from their brood areas in autumn (Pedersen et al. 1999). Based on published dispersal distances for radio collared willow ptarmigans in Norway (Myrberget 1976, Pedersen et al. 1999, Brøseth et al. 2005), chicks rarely disperse in such distances that they move to an another management unit. Studies of collared willow ptarmigans have also shown that these birds rarely leaves hunted areas or areas with high hunting pressure, favouring areas with none or less hunting (Olsson et al. 1996, Brøseth & Pedersen 2010). The ptarmigan density estimated by the autumn survey before the onset of the hunting season in middle of September should thus represent the density experienced by the hunters some weeks later reasonably well. If reduced hunting pressure in a managed area is desirable, reduced access to buildings and/or roads could be an appropriate measure (Pedersen & Karlsen 2007). In the same way could potentially non-hunting managed refuges, with sufficient size and locations reduce hunting pressure. However, before taking such actions, it is important to locally monitor the willow ptarmigan populations using a reliable transect survey and the expected effect should be more thoroughly examined. Further, areas near roads and/or buildings could be used primarily as dog training areas, practically acting like natural hunting refuges (see also Pedersen & Storaas 2013). Andersen et al. (2010) showed that Norwegian willow ptarmigan hunters have a relatively high acceptance for hunting refuges, as long as they do not cover more than 30% of the total managed hunting area. Conclusion and RecommendationsOur study indicates that most of the ptarmigan hunting terrain in the study area could potentially be accessed by hunters during a day of hunting. The current hunting management scheme, where non-hunting managed refuges only occasionally are used, ptarmigan could potentially be experience risk of being hunted almost everywhere inside the management units. Since our survey also showed a higher ptarmigan density in management units with greater proportions of natural refuges, this might give some support to the importance of such non-hunted areas and that they could potentially serve as source areas. We recommend further research on this topic, primarily with a larger dataset also covering other regions and landscape types. Further studies should also examine the potential effects of human disturbance on a more local scale, than in the whole management unit. Finally we recommend the ptarmigan managers that currently do not have or in an insufficient way estimate their ptarmigan density by annual line transects, to establish such. These line surveys must have a good geographical spread, to ensure that they cover the management units in different distances from roads and buildings. In turn, these estimates should form the basis for geographically defined terrain quotas inside the respective units. ReferencesAndersen, O., Kaltenborn, B.P., Pedersen, H.C., Storaas, T., Faye-Schjøll, E. & Solvang, H. 2008. Survey among willow ptarmigan hunters after the hunting season 2006/07. Data and key findings from the Grouse management project 2006 – 2011. NINA Report 379. (In Norwegian with English summary). Andersen, O., Kaltenborn, B. P., Pedersen, H. C., Storaas, T., Solvang, H., Moa, P. F. og Hagen, B. R. 2010. Survey among managers in the Grouse management project 2006 - 2011. Data and key findings - NINA Report 433. (In Norwegian with English summary). Andersen, R., Linnell, J.D.C., Langvatn, R., 1996. Short term behavioural and physiological response of moose Alces alces to military disturbance in Norway. Biological Conservation 77, 169–176. Anderson, D.W. 1988. Dose–response relationships between human disturbance and brown pelican breeding success. Wildlife Society Bulletin 16, 339–345. Bevanger, K. 1998. Biological and conservation aspects of bird mortality caused by electricity power lines: a review. Biological Conservation 86, 67-76. Brøseth, H. & Pedersen, H.C. 2010. Disturbance effects of hunting activity in a willow ptarmigan Lagopus lagopus population. Wildlife Biology 1, 241-248. Johansen, B. E. (2009). Vegetation mapping of Norway, using Landsat TM/ETM+ data. Norut Report 4: 1-87. Tromsø, Norway, Northern Research Institute. (In Norwegian with English summary). Finney S.K., Pearce-Higgins J.W. & Yalden D.W. 2005. The effect of recreational disturbance on an upland breeding bird, the golden plover Pluvialis apricaria. Biological Conservation 121, 53-63. FitzGibbon, C. 1998. The management of subsistence harvesting: behavioural ecology of hunters and their mammalian prey. Behavioural Ecology and Conservation Biology (ed. T. Caro), pp. 449-473. Oxford University Press, New York, NY. Gill, J.A., Sutherland, W.J., Watkinson, A.R., 1996. A method to quantify the effects of human disturbance on animal populations. Journal of Applied Ecology 33, 786–792. Kerbiriou, C., Le Viol, I., Robert, A., Porcher, E., Gourmelon, F., & Julliard, R. 2009. Tourism in protected areas can threaten wild populations: from individual response to population viability of the chough Pyrrhocorax pyrrhocorax. Journal of Applied Ecology, 46(3), 657-665. McCullough, D.R. 1996. Spatially structured populations and harvest theory. Journal of Wildlife Management 60, 1-9. Myrberget, S. 1976. Hunting, mortality, migration and age composition of Norwegian willow grouse Lagopus lagopus. Norwegian Journal of Zoology 24, 47–52. Novaro, A. J., Funes, M. C. & Walker, R. S. 2005. An empirical test of source–sink dynamics induced by hunting. Journal of Applied Ecology 42, 910-920. Olsson, G. E., Willebrand, T. & Smith, A. A. 1996. The effects of hunting on willow grouse Lagopus lagopus movements. Wildlife Biology 2, 11-15. Pedersen, H.C., Eide, N.E., Pedersen, S., Solvang, H. & Storaas, T. 2006. Hytter, ryper og generalistpredatorer i fjellet. NINA Minirapport 174, 17s. (In Norwegian). Pedersen, H.C. & Karlsen, D.H. 2007. Alt om rypa. Biologi - jakt - forvaltning. Tun Forlag. (In Norwegian). Pedersen, H.C., Steen, H., Kastdalen, L., Brøseth, H., Ims, R.A., Svendsen, W. & Yoccoz, N.G. 2004. Weak compensation of harvest despite strong density–dependent growth in willow ptarmigan. Proceedings of the Royal Society of London. Series B: Biological Sciences, 271, 381-385. Pedersen, H.C., Steen, H., Kastdalen, L., Svendsen, W. & Brøseth, H. 1999. Betydningen av jakt på lirypebestander. Framdriftsrapport 1996-1998. NINA Oppdragsmelding 578, 1-43. (In Norwegian). Pedersen, H.C. & Storaas, T. 2013. Rypeforvaltning, Cappelen Damm forlag. (In Norwegian). Pedersen, Å.Ø., Jepsen, J.U., Biuw, M. & Johansen, B. 2012. Habitat model for willow ptarmigan in Finnmark. NINA Report 845. (In Norwegian with English summary). Pulliam, H. R. 1988. Sources, sinks, and population regulation. American Naturalist, 652-661. Røhnebæk, E. 2004. Rødrevens aktivitet i forhold til hyttefelt. Sporfordeling av rødrev og byttedyr i og rundt fem hytteområder i Ringsakerfjellet. Bacheloroppgave. Avdeling for skog- og utmarksforvaltning, Høgskolen i Hedmark. (In Norwegian). Sandercock, B.K., Nilsen, E.B., Brøseth, H. & Pedersen, H.C. 2011. Is hunting mortality Storch, I. 2007. Conservation status of grouse worldwide: an update. Wildlife Biology 1: 5-12. SLF & DN 2010. Skogsveibygging og hensynet til inngrepsfrie naturområder i Norge Smith, A. & Willebrand, T. 1999. Mortality causes and survival rates of hunted and unhunted willow grouse. Journal of Wildlife Management 63: 722-730. SSB1: Statistisk sentralbyrå – felt småvilt: http://www.ssb.no/srjakt/. Read 12.10.2013. SSB2: Statistisk sentralbyrå – bygningsmasse: http://www.ssb.no/bygningsmasse. Read 12.10.2013. SSB3: Statistisk sentralbyrå – jegere på jakt: http://www.ssb.no/jeja/. Read12.10.2013. Støen, O.G., Wegge, P., Heid, S., Hjeljord, O. & Nellemann, C. 2010. The effect of recreational homes on willow ptarmigan (Lagopus lagopus) in a mountain area of Norway. European Journal of Wildlife Research, 56, 789-795. Weimerskirch, H., Shaffer, S.A., Mabille, G., Martin, J., Boutard, O. & Rouanet, J.L. 2002. Heart rate and energy expenditure of incubating wandering albatrosses: basal levels, natural variation, and the effects of human disturbance. Journal of Experimental Biology 205, 475–483. Willebrand, T. & Hörnell, M. 2001. Understanding the effects of harvesting willow ptarmigan Lagopus lagopus in Sweden. Wildlife Biology 7, 205-212. |